Equity MFs: Are 2-yr CAGR returns a better indicator than 3- or 5-yr returns?
One of the criteria used by equity MF investors to shortlist a scheme is looking at prior period returns. Typically, they have access to returns across several time spans (example here) such as 1-year compounded annual growth rate (CAGR), 3-year CAGR, 5-year CAGR and so on.
Apart from these, various advisors/service providers have different criteria for ranking funds. How does an investor make sense of all this?
Here, we have tried to simplify the process of choosing a fund by analysing prior period returns.
For this, we randomly picked 18 large-cap funds and ranked them every month based on their 2-year, 3-year, 4-year and 5-year compounded returns starting from January 2005. We chose this month since before this only 7 large-cap schemes existed. Due to tax incidence we did not use 1-year return and due to limited history not beyond 5 years.
Also, for a uniform outperformance/underperformance comparison we used a single and uniform index – Nifty 50.
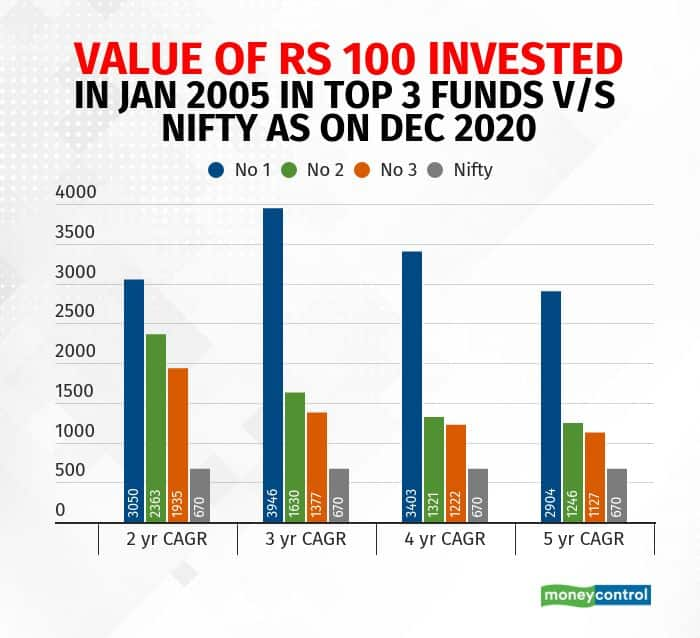
Now, assume that an investor invests Rs 100 in a top 3 fund in January 2005. She then follows this investment strategy: every month exits her investment if the fund is no longer in the top 3 and reinvests the proceeds in a top 3 fund. If this monthly process continued till December 2020, this is what the returns would have looked like.

For example, if the investor chose the 4-year CAGR as the preferred yardstick and invested in the No 3 scheme in January 2005, it would have grown to Rs 1222 now. A key thing to note in the computation that led to Rs 1222 is this: the investor would have entered the scheme when it was ranked No 3 and sold it off when it was no longer No 3 and re-invested the proceeds in the new No 3 fund.
Using this method to enter, exit and re-invest in the top schemes based on different periods’ CAGR shows that the returns on the top 3 funds in each time period comfortably beat Nifty returns. So, even if the investor had stayed invested in a particular scheme so long as it was in the top 3, her returns would have been higher than market returns.
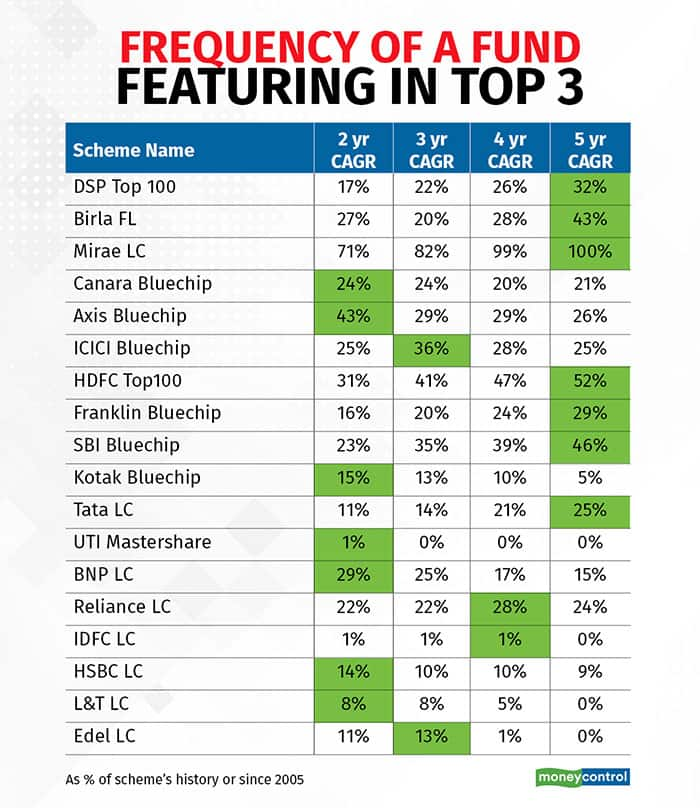
In order to objectively analyse a scheme’s performance, we computed the number of times a fund featured within the Top 3 performing schemes using different CAGR. So, greater the number of times a scheme features, then the returns delivered would also be higher and vice versa. Since different schemes were launched over different time period, we computed this on a percentage basis.

For example: HDFC Top 100 scheme has been amongst the Top 3 schemes for 52 percent of the time based on 5-year CAGR. Similarly, based on 2-year CAGR, Axis Bluechip fund featured in the top three 43 percent of the time.
The figures in green show the maximum amount of time (on percentage basis) a scheme has featured in the Top 3 among different CAGR tenor.
Thus, for the eighteen schemes we find that seven schemes each have featured the maximum amount of time in the Top 3 in the 2-year and 5-year CAGR buckets.
Now, investors would want a consistent performer rather than one delivering superior returns sporadically. More consistency in outperformance over the benchmark index would not only make the investor stay invested in the scheme but such an investment strategy is also more likely to provide greater returns over the lifetime due to the power of compounding.
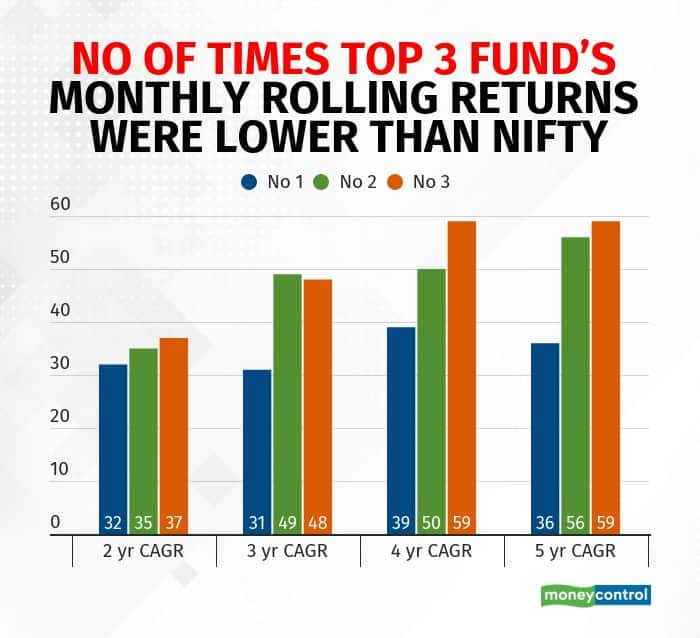
Hence, to identify which of the tenors provided more consistent returns, we calculated the number of times the Top 3 schemes did not outperform the Nifty in a particular month. So, the category which had the least number would have been more consistent.

The above table reflects the number of months over the last 16 years (192 months) the top scheme under the respective category has underperformed Nifty. For example: the No 1 fund using 2-yr CAGR formula, delivered lower than Nifty returns for 32 different months over the last 192 months ( about 17 percent of the time). Similarly, the No 2 fund in the 5-year CAGR bucket underperformed the Nifty for 56 months.
Conclusion:
Comparing the above 3 tables we believe that the 2-year CAGR is a better yardstick. The rationale is this: while 3-year CAGR and 4-year CAGR have yielded higher returns (as seen in Table 1) under the No 1 ranking, the same formula has yielded lower returns for the No 2 and No 3 schemes compared to 2-year CAGR. Also, the error months (no of rolling months when the returns are lower than Nifty in Table 3) is lower for the 2-year CAGR which highlights the higher probability of the Top 3 funds to consistently provide better returns.
Hence, based on this analysis, investors are likely to benefit more if they use 2-year CAGR returns for shortlisting their equity MF scheme.
Disclaimer: The views and investment tips expressed by investment experts on Moneycontrol.com are their own and not those of the website or its management. Moneycontrol.com advises users to check with certified experts before taking any investment decisions.
Originally Published: https://www.moneycontrol.com/news/opinion/equity-mfs-are-2-yr-cagr-returns-a-better-indicator-than-3-or-5-yr-returns-6722351.html
